
Contents (13)
- Web Performance Metrics
- 1. Introduction to Performance Metrics
- 1.1 Core Web Vitals (Core Metrics)
- 1.2 Other Performance Metrics (not official Core Web Vitals; deprecated or supplementary)
- 1.3 Page Experience Factors
- 2. What Causes Poor Core Metrics and How to Fix Them
- 2.1. Slow LCP (Largest Contentful Paint)
- 2.2 Slow FCP (First Contentful Paint)
- 2.3 High CLS (Cumulative Layout Shift)
- 2.4 Slow INP (Interaction to Next Paint)
- 2.5 Common Optimization Techniques
- 3. Measuring Performance Metrics
- 4. Wrapping Up
Web Performance Metrics
This post walks through the metrics used to evaluate web page performance and how to improve them.
The goal is to briefly learn how to optimize the user experience along the way.
1. Introduction to Performance Metrics
There are many performance metrics, such as LCP, FCP, CLS, and TTFB. Google and web.dev pick out the core ones from among them. In the past, LCP, FID, and CLS were introduced as the Core Web Vitals in the Google docs. But these performance metrics keep getting updated.
1.1 Core Web Vitals (Core Metrics)
Here are the Core Web Vitals and their thresholds as of January 2026.
LCP (Largest Contentful Paint)
The time when the largest content element on the page (an image, video, text block, etc.) starts rendering
Recommended threshold: LCP should occur within
2.5 seconds2 seconds after the page starts loading. (2 seconds or less from 2026)Loading experience metric
CLS (Cumulative Layout Shift)
How much the layout shifts while the page is loading
Recommended threshold: under
0.10.08Visual stability metric
FCP (First Contentful Paint)
The time until the first content is rendered in the DOM → how fast the initial load feels
Recommended threshold: 1.5 seconds (newly added)
INP (Interaction to Next Paint)
Comprehensively measures the latency of all interactions, including the time until the screen is actually repainted
Recommended threshold: 150ms (replaces FID)
1.2 Other Performance Metrics (not official Core Web Vitals; deprecated or supplementary)
Let's take a look at the other performance metrics too.
TTFB (Time to First Byte)
The time it takes the server to respond with the first byte → server performance and network issues
Recommended threshold: 300ms or less
TTI (Time to Interactive)
The time until the page actually becomes interactive (the time until the page is fully ready for user interaction)
Recommended threshold: under 5 seconds on mobile, but since it's heavily affected by interactions, measuring INP is recommended.
TBT(Total Blocking Time)
The time between FCP and TTI
Recommended threshold: 300ms on mobile, 100ms on desktop
SI (Speed Index)
Evaluates how quickly the screen is visually drawn (it captures the page like a video and measures how fast it fills in)
Recommended threshold: it varies a lot depending on the content, so there's no clear value. Mobile: 0~3.4s, desktop: 0.~2.5s
FID (First Input Delay) => Apparently, starting in March 2024, INP is an official Core Web Vital replacing FID.
The time it takes the browser to repaint the screen after the user's first interaction (click, scroll, etc.) with the page
Recommended threshold:
100ms80ms or lessAn interaction responsiveness metric; Chrome tools no longer guarantee this metric's availability as of September 9, 2024.
1.3 Page Experience Factors
Mobile-friendliness: a smooth UX on mobile
HTTPS security: serving pages securely
Non-intrusive ads: ad placement that doesn't disrupt the user experience
Clear content separation: no confusion between content and ads/other elements
2. What Causes Poor Core Metrics and How to Fix Them
Now let's look at what causes poor numbers on the four core metrics: LCP, FCP, CLS, and INP.
2.1. Slow LCP (Largest Contentful Paint)
Slow server response (TTFB)
Causes
Longer backend database queries and dynamic page generation times
Underpowered hosting infrastructure (shared hosting)
Physical distance issues from not using a CDN
Solutions
Measure and optimize bottlenecks with the Server-Timing header
Use a CDN to reduce RTT (Round Trip Time)
Cache static HTML (with ETags or short cache lifetimes)
Enable compression (Brotli > gzip)
Render-blocking CSS
Causes
Large CSS files in <head> block rendering until they're downloaded
CSS @import declarations trigger sequential requests (long network request chains)
Solutions
Inline critical CSS in a <style> tag
Place the remaining CSS at the end of <body> or load it asynchronously
Minify CSS and remove unused CSS
Use <link> elements (instead of @import)
Load conditionally with the media attribute (media="print")
Insufficient image optimization
Causes
Oversized images (relative to the viewport size)
Not using modern formats like WebP/AVIF
No proper compression
Solutions
Serve responsive images with the srcset/sizes attributes
Use WebP and AVIF formats (with fallbacks via the <picture> element)
Compress images (lossy/lossless, using Squoosh or ImageOptim)
Apply fetchpriority="high" to the LCP image
Load the LCP image first with <link rel="preload"> + fetchpriority="high"
Incorrect lazy loading
Causes
loading="lazy" applied to images in the initial viewport
Solutions
Use loading="eager" (the default) for images visible without scrolling
Apply loading="lazy" only to images outside the viewport
Slow web font loading
Causes
External @font-face declarations are discovered late
Cross-origin delays from third-party font services
Solutions
Use <link rel="preload" as="font" crossorigin>
Inline @font-face declarations in a <style> tag
Self-host fonts (instead of using Google Fonts)
Use only the WOFF2 format (best compression ratio)
Create font subsets (only the glyphs you need => if you only need English characters, extract just those)
Insufficient video optimization
Causes
Oversized video files
Inefficient codecs
Solutions
Compress with FFmpeg (-crf option, -an to strip the audio)
Provide multiple formats: WebM (VP9/AV1) and MP4 (H.264)
Set a poster image with the poster attribute
Preload the poster image if it's the LCP element
2.2 Slow FCP (First Contentful Paint)
Render-blocking resources
Causes
Large CSS/JS in <head> blocks rendering until it's parsed and executed
Even code that isn't needed for the initial render gets loaded
Solutions
Minify CSS and inline critical CSS
Add the defer or async attribute to JavaScript
Use type="module" (deferred automatically)
Minimize parser-blocking scripts
Apply Critical CSS (inline styles only for the area visible without scrolling, or declare the CSS in an HTML style tag)
Code splitting
Use lazy imports
No resource compression/caching
Causes
Not using Gzip/Brotli
No CDN caching configured
Solutions
Prefer Brotli compression (instead of gzip)
Compress static resources (1 KiB or larger)
Prefer static compression over dynamic compression
Set Cache-Control headers
Redirects
Causes
Extra HTTP requests from same-origin/cross-origin redirects
Solutions
Remove unnecessary redirects
Point internal links directly to the correct URLs
Keep trailing slashes consistent (redirect example.com/page/ => example.com/page, or the other way around)
Slow server response (TTFB)
Same as the TTFB solutions in the LCP section
2.3 High CLS (Cumulative Layout Shift)
Unspecified image/video dimensions
Causes
No width/height set on <img> and <video>
Layout recalculation when images load
Solutions
Always specify the width and height attributes
Use the aspect-ratio CSS property
Web font FOUT/FOIT
Causes
With font-display: swap, the layout changes when the fallback font is swapped for the web font
With font-display: block, the text flickers
Solutions
Use font-display: optional (keeps the fallback font if the font fails to load within 100ms)
font-display: fallback (a short block period + swap)
Tune the fallback font's metrics to closely match the web font (or switch to a font that doesn't cause CLS)
Load web fonts faster with preload
Dynamically inserted content
Causes
Banners, ads, and notifications suddenly inserted above existing content
DOM elements added dynamically with JavaScript
Solutions
Reserve space in advance for dynamic content
Secure the space with the min-height CSS property
Use skeleton UIs
Late-loading iframes
Causes
Layout changes on load because the <iframe> has no specified dimensions
Solutions
Specify the width and height attributes
Apply loading="lazy" (outside the viewport)
2.4 Slow INP (Interaction to Next Paint)
Main thread blocking
Causes
Heavy JavaScript execution (parsing, compiling, executing)
Large-scale rendering work
Long Tasks (50ms or longer)
Solutions
Minify and uglify JavaScript
Load only the code you need with code splitting
Use the defer and async attributes
Minimize client-side rendering
Code splitting
Use lazy imports
Offload libraries unrelated to DOM manipulation to a web worker with Partytown
Apply throttling and debouncing
Parser-blocking JavaScript
Causes
<script> (without defer/async) blocks HTML parsing
Solutions
Use <script defer> (runs after HTML parsing finishes)
Use <script async> (runs as soon as it's downloaded)
Use <script type="module"> (deferred automatically)
Place scripts at the end of <body>
Third-party scripts
Causes
Ads, analytics, chat widgets, etc. hog the main thread
Embedded iframes load additional resources
Solutions
Apply <iframe loading="lazy">
Show a fake UI until the user interacts
Use React Live Chat Loader or lite-youtube-embed
Unnecessary re-renders
Causes
Excessive component re-renders in React/Vue
Solutions
Memoization (React.memo, useMemo)
Split up and optimize components
CSS animation performance
Causes
Animating properties that trigger layout/paint
Solutions
Build animations with properties that can take advantage of GPU acceleration (transform3d, etc.)
Use the will-change property (GPU acceleration)
Check the CSS properties that trigger repaint and reflow in each browser rendering engine.
2.5 Common Optimization Techniques
Resource hints
This technique gives the browser hints so it can find resources quickly. They fetch resources with increasing strength in the order dns-prefetch < preconnect < prefetch < preload.
<link rel="dns-prefetch"> - performs only the DNS lookup early
<link rel="preconnect"> - establishes cross-origin connections early (DNS + TCP + TLS)
<link rel="prefetch"> - loads resources needed later at low priority (used to download files for the next page in advance)
<link rel="preload"> - loads important resources with priority (used for things needed right away for rendering, like images and fonts)
Fetch Priority API
fetchpriority="high" - LCP images, important resources
fetchpriority="low" - thumbnails, less important images
Service worker precaching (not web workers...)
Precache static resources with Workbox
Instant loading with a cache-only strategy
Offline support
Faster navigation with page prefetch/prerender
Automatically prefetch links in the viewport with the Quicklink library
3. Measuring Performance Metrics
There are lots of tools for measuring performance: libraries that report Web Vitals, Chrome's Lighthouse or Performance tab, and various other performance-testing sites. Among them, the PageSpeed Insights site measures website performance on both mobile and desktop. Let's measure the speed of this blog's home page with PageSpeed Insights. The results change every time, so the score can differ by 20 points or more.
I ran a quick measurement through the site, as shown below.
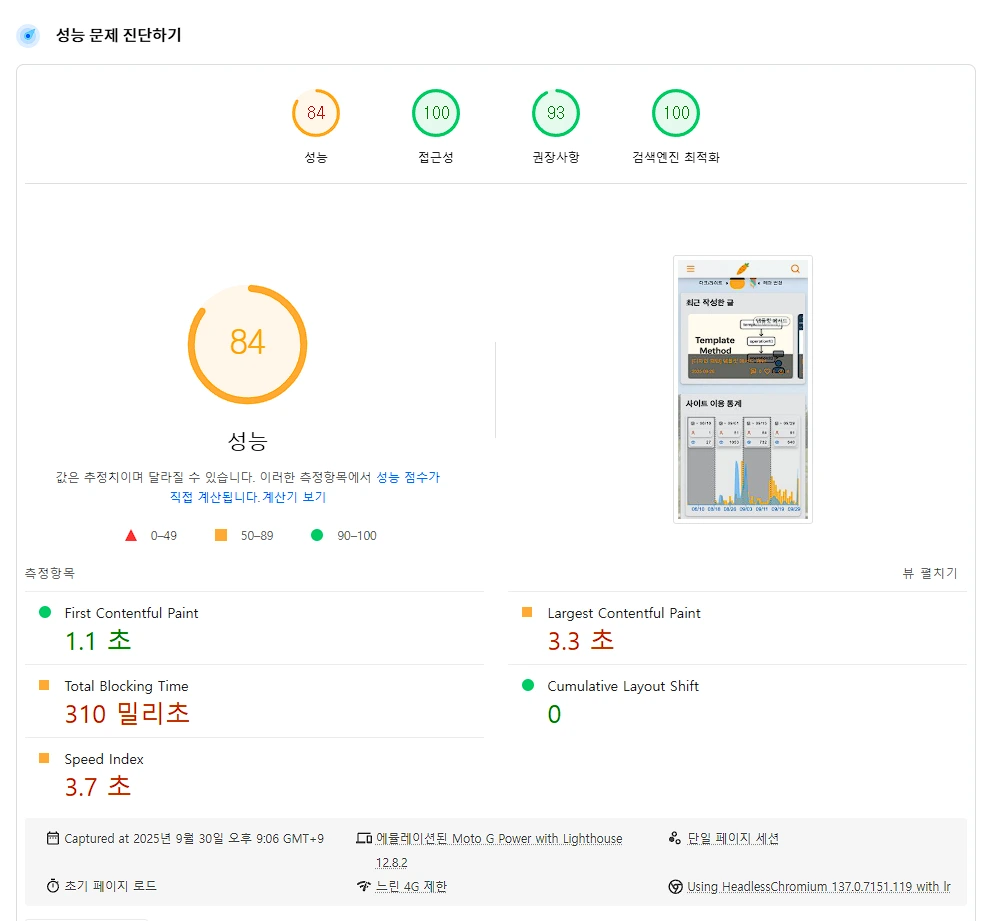 | 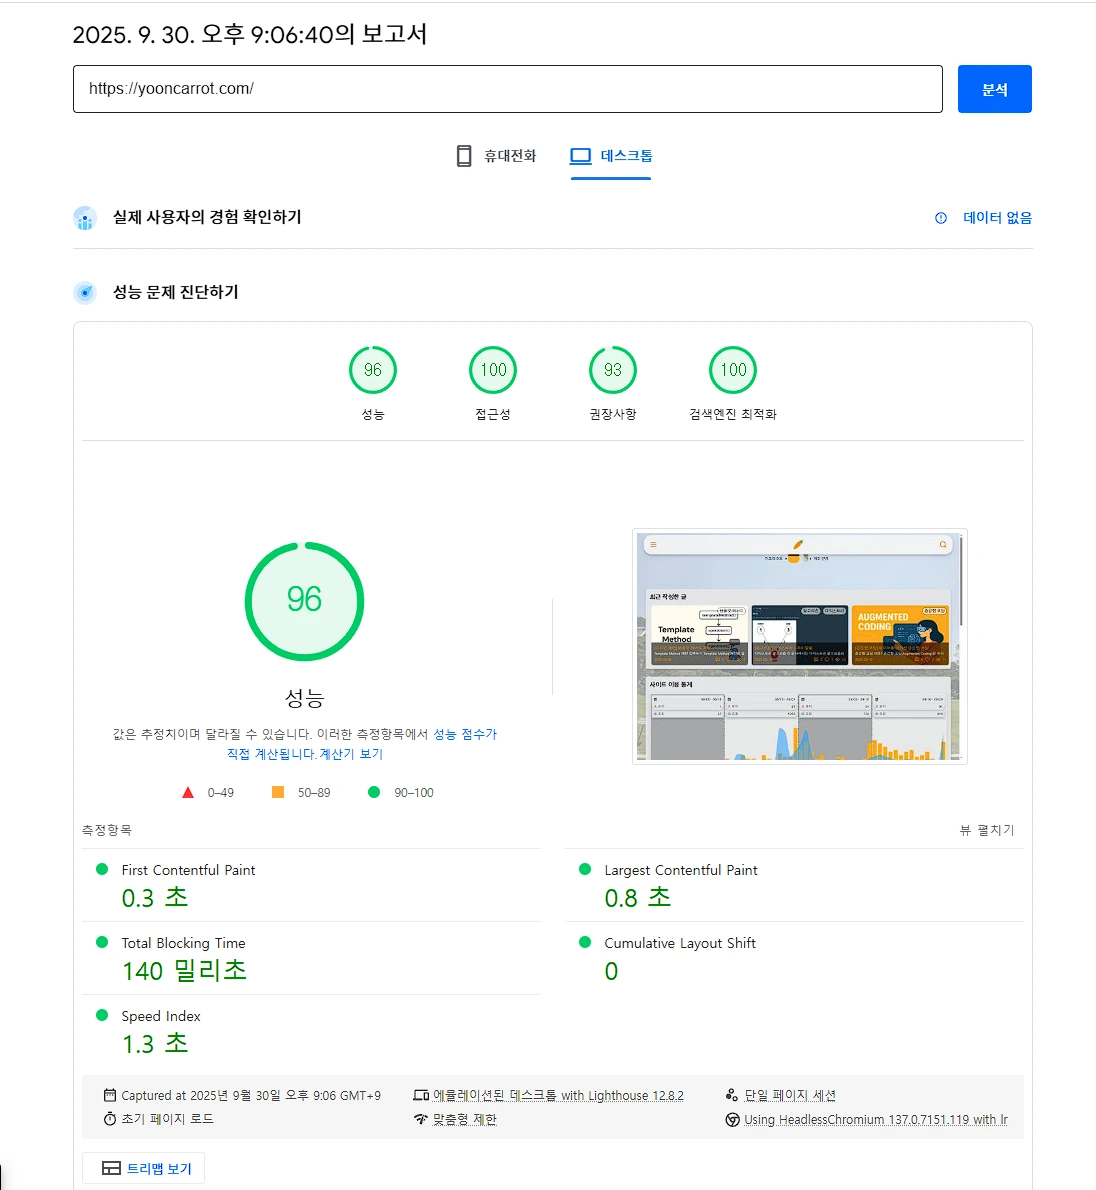 |
Mobile almost always comes out with worse performance. And if you test directly on a device, the speed varies a lot depending on the device's condition.
4. Wrapping Up
So that was a detailed look at performance metrics. While studying how to improve them, I also learned that improving each metric affects the others. The blog I built applies most of the methods listed above, so it gets high web performance scores most of the time when measured with Lighthouse. Web performance optimization isn't that hard!! Look these techniques up and try applying them one at a time.
References