
Contents (15)
- [Blog Introduction] Frontend - Performance Optimization
- 1. Finding the Causes of Poor Performance and Improving LCP, FCP, and CLS
- 1.1 Optimizing FCP and LCP (with Critical CSS)
- 1.2 Improving CLS and Frames
- 1.3 Image Format Optimization
- 1.4 Other Improvements I Made by Finding Causes with Performance Tools
- 2. Minimizing Broken First Renders on Slow Networks (Critical CSS)
- 2.1 Only CSS vs Inline CSS vs Inline Style
- 3. Handling the Background on Refresh (Visual Stability)
- 3.1 Getting Rid of the Momentary White Screen and the Morning Screen.
- 3.2 Showing the Right Screen and Scale for the Scroll Position
- 4. Element Size Changes from Image Loading and TOC Scroll Position Calculation
- 5. Monitoring Real Users' Performance (Sentry)
- 6. Google Login Without Redirects
- 7. Other Improvements I've Noticed
[Blog Introduction] Frontend - Performance Optimization
Thanks for visiting. After my first post, I spent a lot of time fixing the parts of the blog I wasn't happy with, so it took quite a while to get to this second one.
In this post, I'd like to show you the ways I optimized my blog. Before you start reading, here's something to celebrate (together?): as a result of the optimization, I hit a perfect 100 in all four Lighthouse categories. Haha
In this post, I'll walk through how I found what was hurting performance and how I optimized it. On top of that, I'll also cover how I improved things that Lighthouse doesn't score, like [a network so slow it practically errors out] and [the annoying white flash on refresh].
First, the images below show the Lighthouse results for the home screen in four categories (Performance, Accessibility, Best Practices, and SEO) after I fully finished optimizing. Lighthouse is a tool in the Lighthouse tab of Chrome DevTools that lets anyone measure performance easily.
One thing to keep in mind when measuring Lighthouse scores is that the results can vary depending on the user's network, computer, and browser environment. For example, if third-party cookies aren't blocked in the browser, or if the network is slow, the performance results will be different. I recommend blocking third-party cookies in your browser settings, not just when measuring performance but in everyday browsing too.
Home screen (admin login) | Home screen (regular user login) | Home screen (not logged in) |
|---|---|---|
 |  |   |
On the admin account, the number of profile buttons is different, which triggers a reflow and results in a CLS of 0.005. | On a regular account, the intended number of buttons is rendered, so there's no reflow and CLS is 0. | When not logged in, a third-party library prints an error message, which lowers the Best Practices score. |
1. Finding the Causes of Poor Performance and Improving LCP, FCP, and CLS
I'll explain how I tracked down the causes of poor performance and, based on that, how I improved LCP, FCP, and CLS.
First, here's a quick explanation of each term, along with the YoonCarrot site's performance results before optimization.
LCP stands for Largest Contentful Paint: the point at which the largest piece of content is displayed.
FCP stands for First Contentful Paint: the time until rendering first begins on the screen.
CLS stands for Cumulative Layout Shift: how much layout shift occurs after the web page is displayed.
Performance results | Diagnosed causes |
|---|---|
 | 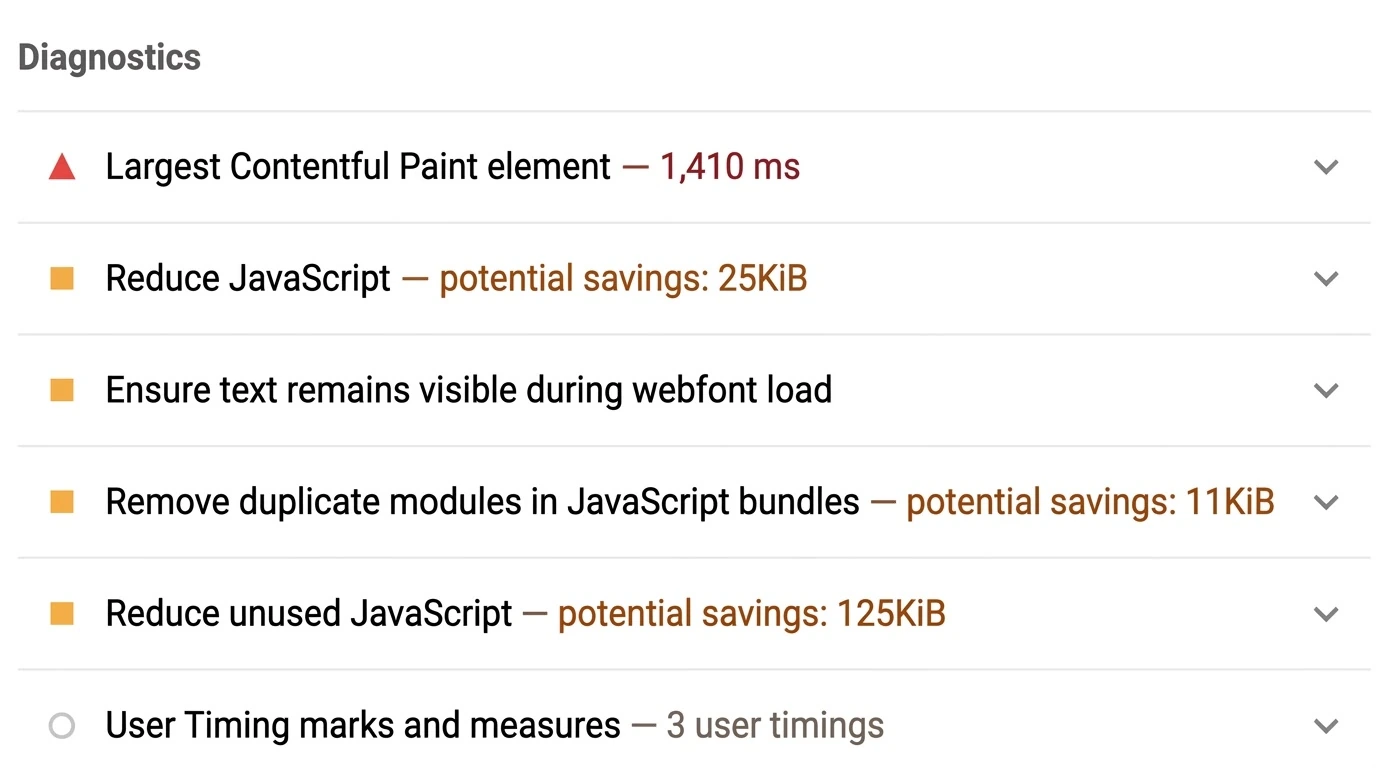 |
If you look at the Lighthouse performance report above, it shows metrics like FCP, LCP, TBT, and CLS and even diagnoses their likely causes. If you know what the metrics mean, you can quickly tell that layout shifts are happening or that there's time when rendering is blocked. Even if you don't know what they mean, you can still improve performance by checking the diagnosed causes and the suggested fixes.
That said, it can be hard to pin down the exact causes with that tool alone. That's why people also use the browser's performance analysis tools. The next image is an analysis I did with a tool in the browser's DevTools. You can see what happened, frame by frame and over time.

When I analyzed it with the performance analysis tool, I got FCP 74 ms, DCL 106 ms, and LCP 171 ms. Pretty different from the Lighthouse results, right?? Yep, that's normal. I actually didn't keep the data from back then, so the Lighthouse result image is an older one, which is why the score is low. Still, let's keep going.
Let me do a quick analysis of the data from the performance analysis tool.
Starting with the frame data, which you can see visually, the sequence was [2 blank frames => 2 frames without images rendered => a frame with LCP complete], so it took until the 5th frame to get a screen worth showing. What seems worth checking here is why the FCP result is a blank screen, and why it drew 2 frames before reaching LCP. (Depending on network conditions and so on, the blank frames or the frames without images may drop to 1.)
If you look at the graph, you'll see a pink line around the middle. That line usually shows up when layout shifts happen multiple times. When I checked, I found that the size of some components changed when the CookieRun font was applied. I could also see that a layout shift happened when the Google Login button appeared.
1.1 Optimizing FCP and LCP (with Critical CSS)
From the two analyses above, here are the conclusions I came to.
The blank FCP frame above happened either because the HTML was rendered without CSS applied, or because the server was in bad shape.
Even in situations like that, my blog should be able to show a stable screen from the very first frame.
The multiple frames generated between FCP and LCP are the result of multiple layout shifts. (See 1.2 Reflow Optimization)
To improve the blog based on the first and second of these conclusions, I applied Critical CSS. If you download CSS as a separate file and apply it, the first frame will be shown without any styles. So the important (critical) CSS is sent inline together with the HTML, and this is what's called Critical CSS. To apply Critical CSS in a Next.js environment, you parse the HTML after the build and replace the parts that load the CSS with the corresponding inline CSS.

The hedgehog above is the mascot of Beasties (formerly Critters), one of the libraries for applying Critical CSS. Below that are the postbuild code that turns the CSS generated after Tailwind processing into inline CSS, and the log printed during a Vercel deployment.
Postbuild.js
import Critters from "beasties";;import fs from "fs";import path from "path";const critters = new Critters({ path: ".next/static/css", publicPath: "/_next/static/css/", inlineFonts: true, preloadFonts: false, preload: "media",});function fromDir(startPath, filter) { if (!fs.existsSync(startPath)) { throw new Error("Is the build folder path correct?") } else { const files = fs.readdirSync(startPath); Promise.all( files.map(async file => { const filename = path.join(startPath, file); const stat = fs.lstatSync(filename); if (stat?.isDirectory()) { fromDir(filename, filter); } else if (filename.endsWith(filter)) { const inlined = await critters.process( fs.readFileSync(filename, "utf8"), ); fs.writeFileSync(filename, inlined); } }), ); }}const promise = new Promise(() => fromDir(".next/server/app", ".html"));promise.then(() => console.log("Done"));
Right now, this method only works for Page Router users on Vercel's servers. App Router users need to use a Custom Server to use inline CSS. (Based on using Tailwind: the script runs, but the result isn't applied.)
I'm on Vercel Server + App Router, so I couldn't apply inline CSS with the Postbuild.js script above. The inline CSS feature currently exists as an experimental feature, and I plan to adopt it once it becomes official. If you want to use it, you can set it up like the next.config.ts below.
next.config.ts
import type { NextConfig } from 'next'const nextConfig: NextConfig = { experimental: { inlineCss: true, },}export default nextConfigSo I extracted the important styles from the Layout myself and put them in a style tag. For now I've added them manually like this, but I plan to switch over once the experimental inline CSS feature is officially released. Below is the component I made so the Layout can insert a style tag directly into the HTML.
HtmlHeadRegistry.tsx
"use client";import {useServerInsertedHTML} from "next/navigation";import {PropsWithChildren} from "react";export default function HtmlHeadRegistry({children}: PropsWithChildren) { useServerInsertedHTML(() => { return ( <> <style>{` @base {span, p { font-size: 1rem; line-height: 1.5; } html { font-size: 16px; @media (width < 48rem) { font-size: 14px; } }} ... omitted `}</style> </> ); }); return <>{children}</>;}1.2 Improving CLS and Frames
Of the conclusions above, I still haven't dealt with the third one. For the third conclusion, it's easy to figure out what's causing the reflow by using a performance analysis tool.
First, a quick explanation of reflow: when the browser applies changed styles to the screen and an element's size, position, or structure changes, a reflow happens along with a repaint. Compared to when only the color changes and only a repaint happens, there's one extra step, so it uses more resources.
Reflow affects performance, but sudden position shifts also hurt the user experience. Luckily, the fix is simple: when you expect a position change, set the width and height in advance. That's also why we give images width and height information.
Below, I compared a Flex box where reflow happens because of automatic CSS calculation with one where I anticipated it and set width/height in advance. You can clearly see from the numbers that LCP and CLS are different.
Relying on automatic CSS calculation | Height set statically |
|---|---|
   |  
 |
In the bottom image, you can see that, to analyze the cause, I labeled the two points causing CLS as ["By font"] and ["Auto CSS calculation"]. | Only the CLS increase from the font remains. |
On the left is the data when rendering with automatic CSS calculation, and on the right is the data after I fixed it by setting width/height statically so the layout doesn't change. The points causing CLS were reduced to just one: the font change.
After that, I also fixed the layout change caused by the font change. I'd been using the CookieRun font I had carefully picked out, but I let it go. Using CookieRun without CLS would mean configuring the font styles in detail, which looked like it would take a long time, so I switched to a popular Google Font.
For screens that are inevitably dynamic, like ones that show lists, I'd still use flex, but for fixed layouts, I think asking the designer to specify width and height might be better for both performance and usability.
Finally, let me show you the final optimized performance results.

FCP and LCP now almost always happen at the same time. In the result above, both happen at 114.78 ms. So the screen rendered in the first frame is now the same as the screen the blog is supposed to show. Apart from the one unavoidable blank frame at the very start, users now always get to see only the complete screen, and quickly.
1.3 Image Format Optimization
To give you the conclusion first: I set it up so that each image is compressed to webp at 92% quality, compared with the original file, and whichever file is smaller gets uploaded. At first I always converted images to webp, but when I actually compared the file sizes, some JPGs with a wide range of colors and PNGs with lots of transparent areas often turned out to be smaller than the webp versions. AVIF has a better compression ratio, but I went with webp and didn't use AVIF because it takes that much more computation to render, and there are still cases where AVIF isn't supported.
1.4 Other Improvements I Made by Finding Causes with Performance Tools
Actually, I had improved performance before the analysis I described above too, but I didn't keep any records from back then, so I'll briefly summarize one interesting improvement from that time.

I had set up CSP so that scripts would run using a nonce, but I didn't realize that since a nonce value has to be injected into every script, the pages would end up being generated with dynamic rendering. As a result, the site got really slow, and after finding the cause through performance analysis, I'm now looking for another way to implement CSP that stays fast.
2. Minimizing Broken First Renders on Slow Networks (Critical CSS)
Next up is how I improved rendering so that broken screens are kept to a minimum even on slow networks.
In a stable environment, the browser fetches the CSS before drawing the screen, but in public places you've probably had the experience of the network briefly becoming unstable, so for a moment you see a screen without CSS, or the whole layout gets twisted around, which is tiring.
To minimize this, you can use Critical CSS. In fact, you just apply the same method as in 1.1.
The two images below compare what happens when the network is unstable and only the HTML is received.
Plain Tailwind 4 + Next 15 (App Router) | Tailwind 4 + Next15(App Router) + Critical CSS |
|---|---|
 |  |
The left is the result of receiving the CSS file and the HTML separately, and the right is the result of sending the important CSS together with the HTML as inline CSS.
On the left, the background CSS isn't applied, so the player shows up at the very top, but on the right, some CSS is applied right away, so the GNB, SNB, and LOGO are displayed.
If the left screen shows up briefly because of a bad network, the whole screen is likely to reflow and give a bad UX, but on the right the layout is already roughly in place, so it's fine. And with the approach on the right, even when the network is bad, you can make the screen at least usable once it appears. In other words, one advantage of Critical CSS is that by tuning the inline CSS, you can decide the spec of the minimum screen you want to show.
So I got curious whether I should always use Critical CSS, and went looking for some comparison data.
2.1 Only CSS vs Inline CSS vs Inline Style
HTML + CSS Sheet | HTML+ Inline CSS | HTML + Inline Style |
|---|---|---|
 |  |  |
There are two ways to apply styles directly in the HTML: Inline CSS and Inline Style. The middle and right images above are examples of each.
So if you ask, "Which approach is the best?", the short answer is that it depends on the environment (device, network, browser, etc.) and on how much the developer applies as Critical CSS or Inline Style.
HTML size comparison | SSR HTML rendering time | Browser rendering time |
|---|---|---|
 |  |  |
CSS < Inline CSS < Inline Style Inline Style is the largest because it doesn't use className. | The time difference between Inline Style, the largest in size, and CSS is only 2 ms. | Time it takes for a user on desktop to reach the FP stage. |
Source: https://danielnagy.me/posts/Post_tsr8q6sx37pl Thank you, Daniel. | ||
Interpreting the data above, when you handle CSS inline,
the initial HTML gets bigger, but since it's usually delivered compressed with Gzip, the real-world impact is small;
even if the HTML gets bigger, the difference in SSR processing time isn't significant;
and the time to FP can improve considerably.
That's what we can conclude. In other words, even if you handle a good amount of CSS inline, the differences in performance and size are small, while the time to FP improves meaningfully.
Of course, depending on which CSS approach you use, you can also think about the correlation between changes in the CSS size itself and changes in the HTML size.
Change in CSS size per page by CSS approach | Change in HTML size by CSS approach |
|---|---|
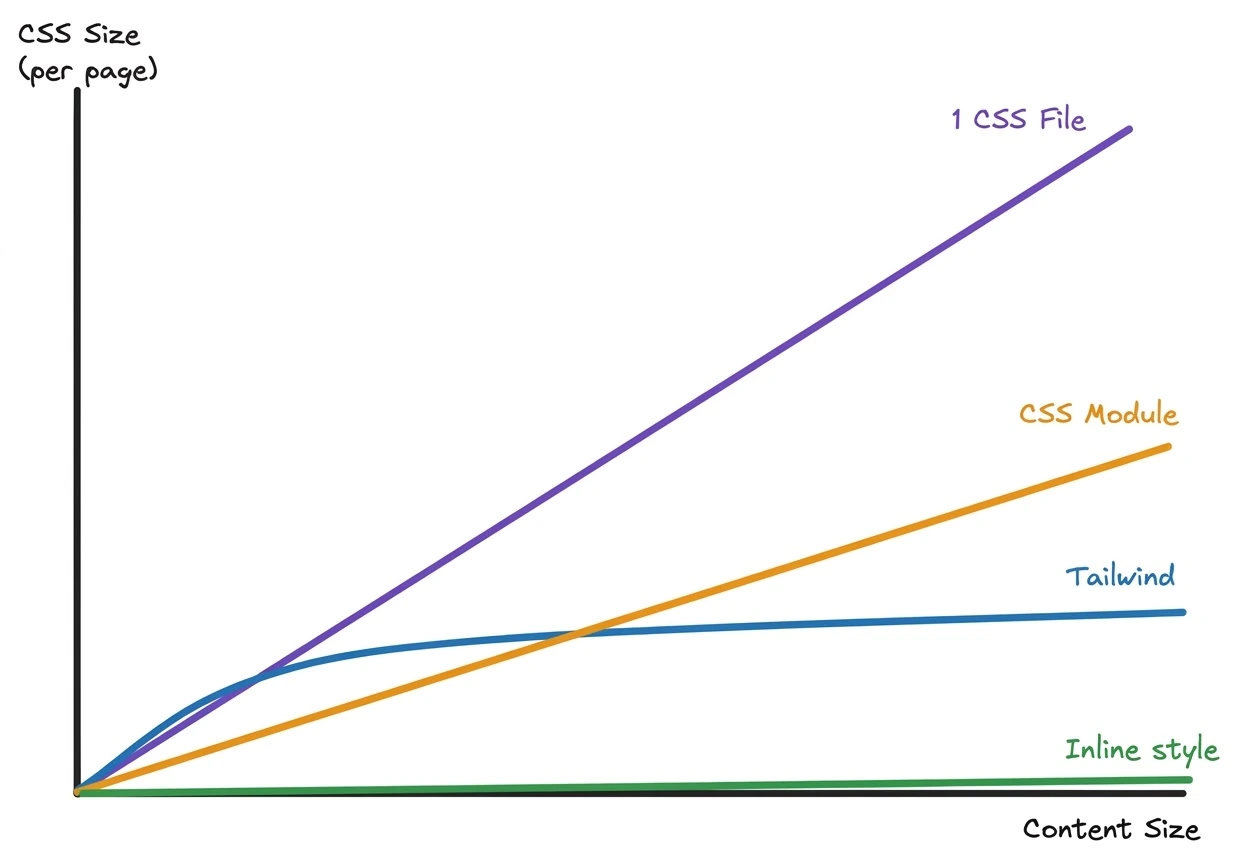 | 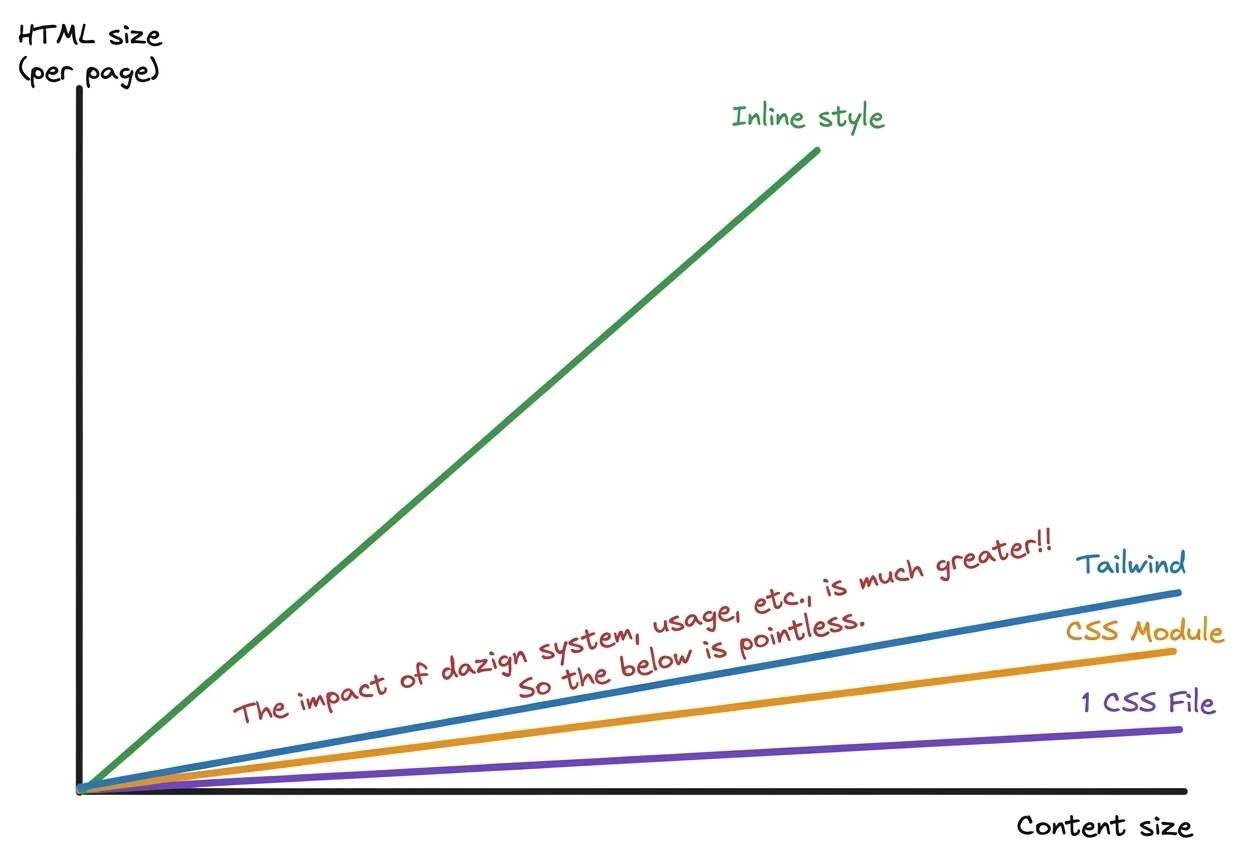 |
A graph I analyzed and drew myself after watching a video by YouTuber Theo-t3.gg. | |
This is a trend line I drew after watching the YouTuber's video and analyzing and thinking it over in my own way. While drawing it, I felt that in reality the results would vary wildly depending on how you build your design system or how you use your CSS library. So it may not mean all that much. I wanted to compare styled-components too, but since it generates style tags dynamically, there's no CSS file, and SSR support seems to have only started recently, so I wasn't sure about it and left it out.
3. Handling the Background on Refresh (Visual Stability)
One thing special about this blog is that the screen changes as you scroll the mouse. Because of that, there were three main problems on refresh.
A white screen flashes for a moment.
Refreshing on the night-view screen shows the morning screen.
The screen isn't shown at the scale that matches the scroll position.
So I went through a lot of trial and error to get rid of these issues. Let me show you how I solved them.
3.1 Getting Rid of the Momentary White Screen and the Morning Screen.
The blog background is made from an MP4, which performs well. But even if it performs well, it's still a video, so it always needs time to load. The problem is that a white or black screen is displayed during that loading time. To change what's displayed while loading, you need to add the poster attribute to the video tag. If you add a poster like below, that image is shown instead while loading.
<video poster={posters[videoIndex]} src={videos[videoIndex]}/>Now the white screen during loading is gone. Next, I'll show you how I made the screen and scale match the scroll position on refresh.
3.2 Showing the Right Screen and Scale for the Scroll Position
The 3.1 method above blocked the white screen, but on refresh there were still problems: the morning background showed up when it should have been the night view, or the screen was shown at a scale that didn't match the scroll position.
My screen transitions work by calculating the scale from the scroll position and swapping the src at specific positions. To fix this, the same scroll position has to be remembered and reused on refresh. So I used the unload event and sessionStorage to remember the position, and used useLayoutEffect with the intent of rendering with the scroll position already reflected in the DOM. Below is the example code.
ScrollVideo.tsx
'use client'export const ScrollVideo = () => { const [videoIndex, setVideoIndex] = useState<0 | 1>(0); useLayoutEffect(() => { // Effect that runs only on the first render // Function that saves scrollY to SessionStorage. function storeScrollY() { sessionStorage.setItem("last-scroll-y", window.scrollY.toString()); } // If the page was reloaded, last-scroll-y exists. const lastScrollY = sessionStorage.getItem("last-scroll-y"); => On the first render, if lastScrollY exists, calculate the scale value and apply it. // Swap the video src as scrollY changes scrollY.on("change", y => { flushSync(() => (y >= 400 ? setVideoIndex(1) : setVideoIndex(0))); }); // Save scrollY to Session Storage on unload. window.addEventListener('unload',storeScrollY); return () => { window.removeEventListener('unload',storeScrollY); scrollY.destroy(); }; }, []); return ( <video poster={posters[videoIndex]} src={videos[videoIndex]} style={{ scale: Scale calculated from scrollY, }}/> );};But even when I actually ran the code above, a white screen still flashed for a split second. That's because when the HTML file arrives, the components are displayed using the HTML placeholder values created on the server, and only after that does hydration happen.
So how should I apply it?? After thinking it over, I concluded that it had to be applied before the React DOM is created. But the only approach I could come up with meant breaking the hydration rules. Still, I figured there was no way around it. There's probably a better approach, but... I just couldn't think of one. So I chose to put a script tag right in the HTML that adds an event to save the scroll position, and to swap the src directly in the DOM before hydration. Below are the example code and a screenshot of the storage where scrollPosition actually gets saved.
RootLayout.tsx
'use client'export const ScrollVideo = () => { return ( <> <video poster={posters[videoIndex]} src={videos[videoIndex]} style={{ scale: Scale calculated from scrollY, }} suppressHydrationWarning={true} /> <script dangerouslySetInnerHTML={{ __html: `function that adds events, function that loads scrollY, video swap function, function that changes video.src, function that changes video.style.scale...`, }} /> </> );}
This way, the video source, the poster, and the scale value are all changed before hydration, so they're applied before the first screen is even drawn. The result: it worked really well. This was already good enough, but I started wanting to restore the original playback time and draw the screen from that moment as the poster. So I gave it a try.
I won't write out the code separately; I'll just share the approach and the conclusion. On unload, I created a canvas object to save the last background frame as data in sessionStorage, and also saved the video's playback time. Then on refresh, the screen showed up exactly as it was. It does work. However, because of the computer's limits, I couldn't get rid of a slight stutter. Since implementing it this way doesn't really change the user experience, I decided it was a waste of resources. So I deleted the code that saves and uses the poster and the playback time.
4. Element Size Changes from Image Loading and TOC Scroll Position Calculation
I explained this in detail in the editor post, so I'll just briefly cover the cause and the fix and move on. When content is shown to users in the Viewer, a TOC gets generated. But because images are loading, the layout calculation keeps changing at first. (It's less of a problem if you set the image width and height.) So element positions change while the TOC scroll positions are being calculated, and you end up with an inaccurate TOC. I solved this by optimizing it with ResizeObserver and debouncing, so the TOC is displayed only once the size hasn't changed for 100 ms or more.
5. Monitoring Real Users' Performance (Sentry)
So far, I've only improved performance in my own computer environment. But in a live service, users in all kinds of environments use it, and the results will differ depending on those environments. Errors can even happen depending on the environment. That's why it's a good idea to check real users' performance scores too.
There are various ways to check real users' performance scores. You can use Speed Insights provided by Vercel, or check them in an error logging system like Sentry. I needed detailed analysis and fixes for errors, so I used Sentry for performance analysis as well. Sentry's performance scores also keep changing depending on server network and traffic conditions, and you can track those changes over time. Below is a screenshot of the Sentry performance monitoring screen for the YoonCarrot blog.


You can see the hourly averages of values like FCP, LCP, CLS, INP, and TTFB for the Next frontend. You can also check them in detail page by page. You can even monitor when the Next server revalidated cached data or pages. And the image below shows values like FCP and LCP for each page.

With Sentry, you can check whether performance stays good on [any page], in [any browser], in [any environment]. With this data, if [a certain page] performs poorly in [a certain browser], I can immediately use that browser to find the problem faster.
6. Google Login Without Redirects
At first, I implemented login using Spring and OAuth 2.0. There are already plenty of references, so it's easy to implement, but in the process of passing the code via OAuth 2.0, a redirect was unavoidable. That's because after Google login, the backend receives the authorization code through a redirect via the URL path, issues an authorization token, and uses it to fetch the user's info from the API.
I felt redirects hurt the user experience, so for a redirect-free login, instead of OAuth 2.0 I used the Google SDK, which separates Authorization from Authentication so the frontend handles only authentication and the authentication data can be passed along via POST.
The frontend side was easy, but the backend turned into a completely custom login, so I had to use Java Spring Security's AbstractAuthenticationProcessingFilter, and there was way too much to implement. I thought that if I ever implemented login this way on a team, I'd definitely have to ask the backend developers for their understanding first. Of course, this SDK can also redirect so that it works as an OAuth 2.0 login.
Anyway, when I actually applied it, there was no redirect, so there was no flicker and the screen was more comfortable to look at. However, since there's no flicker, users might not notice that they've logged in, so I plan to add something like a loading indicator.
7. Other Improvements I've Noticed
Properly splitting CSS files per component
Applying component streaming where needed, such as lists
Optimizing image output per device (including storage)
Summarizing and shortening the description for SEO
Client-side React Query data caching
React Query caching of Next server component streaming data
Cleaning up the design system (Space, Font, etc.)
Centralizing scroll event management (creating a Provider)
Improving legibility of font color against the background