
Contents (8)
- [Blog Introduction] Creating Zero Downtime (Blue/Green) Deployments
- Why did the previous deployment freeze for 32 seconds?
- Changed Zero Downtime Deployment (Blue/Green)
- Caddy configuration for zero-downtime deployment
- Finishing existing requests (Graceful Shutdown)
- Check if there are any issues with the local cache (Caffeine).
- Did it really not cut off for even a second after the Green/Blue switch?
- Things I gained and things I want to try in the future
[Blog Introduction] Creating Zero Downtime (Blue/Green) Deployments
This article was written by [Human 50%, AI 50%].
Yesterday, I migrated my blog backend from AWS Lightsail to the GCP Seoul region and even set up GitHub Actions automated deployment.
Automated deployment made things more convenient, but one drawback remained. Every time I deployed, the existing Spring container was taken down and a new one started. While changing the container itself only takes one second, it takes about 20 to 30 seconds for Spring Boot to fully start up inside the new container . During that time, if a visitor tried to access the site, a 502 error would occur, and requests that were currently being processed could be interrupted midway.
In this post, I explained how I created a Blue/Green deployment with zero downtime in an environment with a single 2GB memory server (e2-small) , and summarized the local cache (Caffeine) and safe shutdown (Graceful Shutdown) that I considered while building it.
There are three goals.
There should not be a single second of pause (502) during distribution.
Requests that have already entered and are being processed must be completed before being turned off.
If there is a problem with the new version, the deployment should simply be cancelled without affecting the existing service.
Why did the previous deployment freeze for 32 seconds?
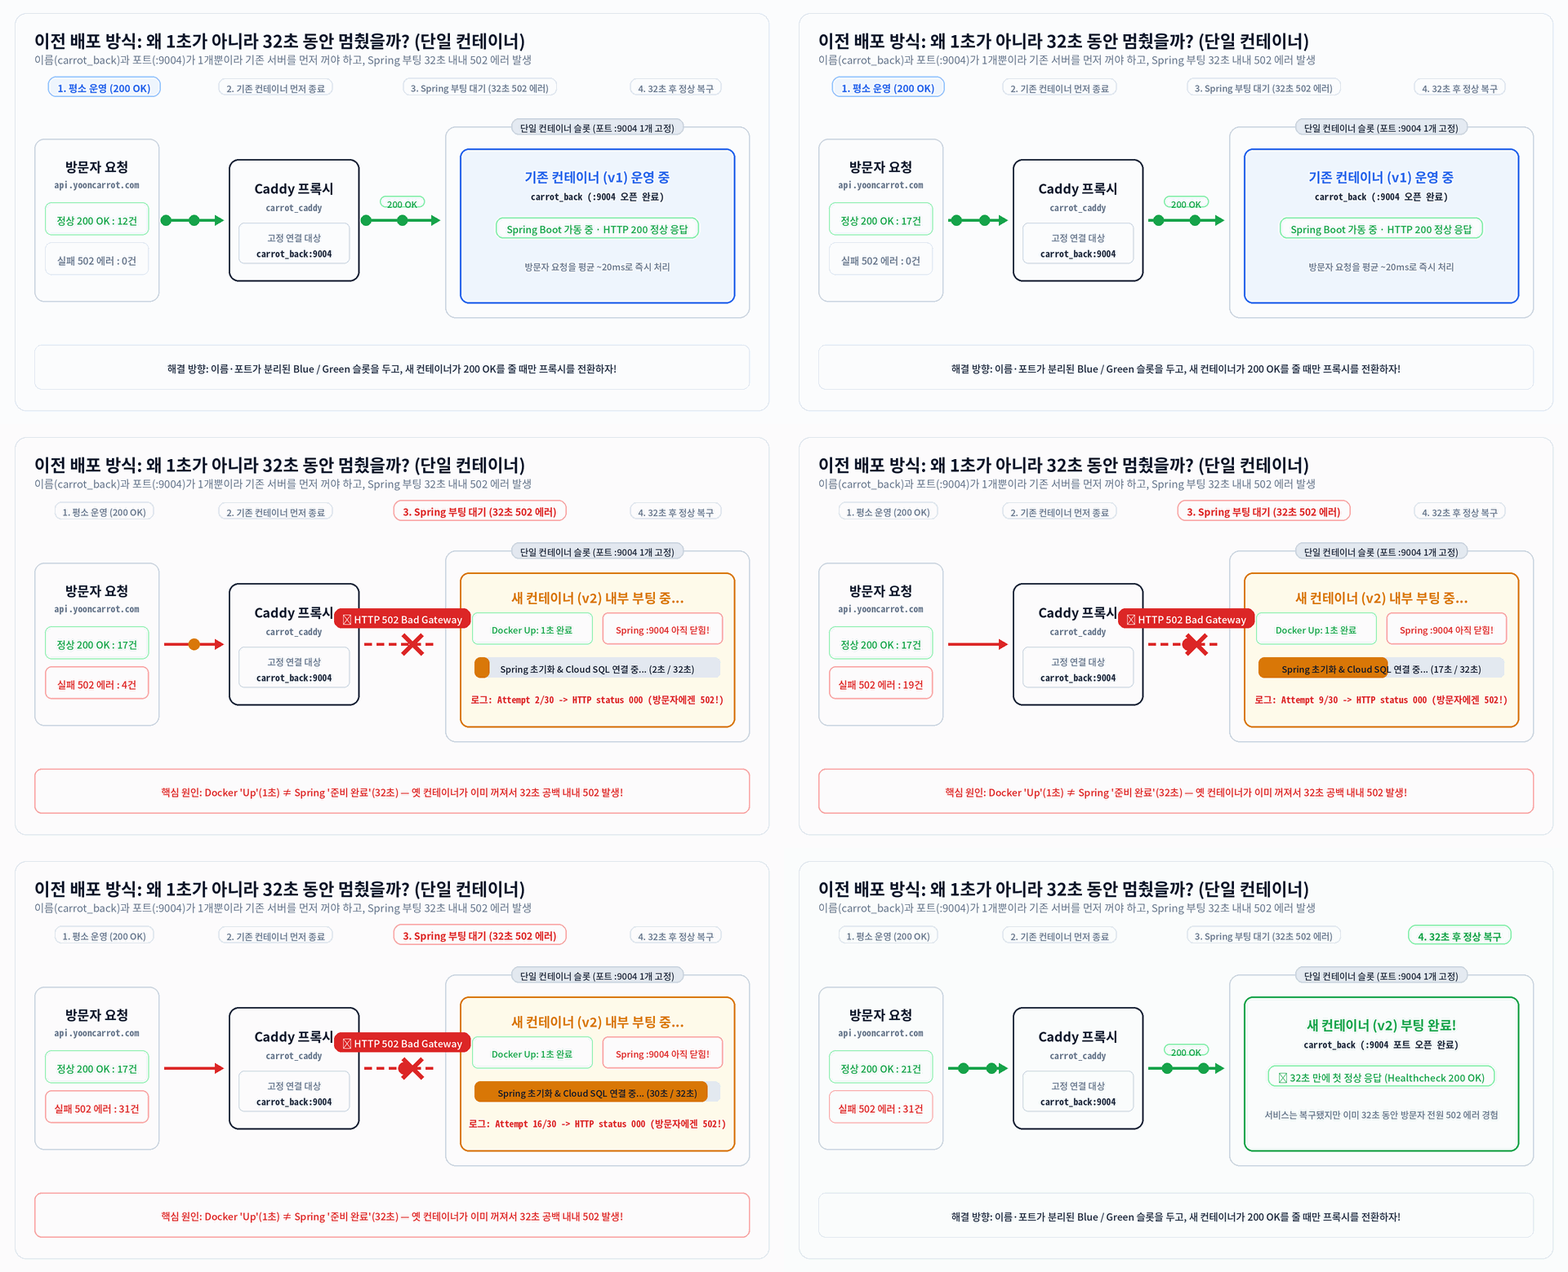
At first, it is easy to think, "Taking a container down and starting it up only takes 1 second, so it will only stop for a very brief moment." However, when I actually opened the last single container deployment log that ran right before applying Blue/Green, I found that there was no connection at all for about 32 seconds (502) .
11:05:33 [deploy] Starting containers... ← 기존 carrot_back 정지 & 새 컨테이너 시작11:05:40 [deploy] Attempt 1/30: HTTP status 000 ← 아직 Spring 켜지는 중 (방문자에겐 502)...11:06:03 [deploy] Attempt 12/30: HTTP status 00011:06:05 [deploy] Healthcheck passed (HTTP 200) ← 드디어 첫 정상 응답!It was for two reasons.
Since there was only one name and one port, I had to shut down the old one first. Previously, a container named 'carrot_back' was using only port 9004, so when I ran `docker compose up -d`, I had to shut down the existing container first before I could launch the new one.
Docker's "Up" was not Spring's "200". Docker considers the container to be up in just one second as soon as the java -jar command starts executing, but it takes over 25 seconds for Spring Boot inside to read classes, establish a Cloud SQL connection, and open ports.
Since the Spring server was running for those 32 seconds, all visitors who came in had no choice but to see a 502 error.
Changed Zero Downtime Deployment (Blue/Green)
The Blue/Green deployment method is displayed in two main ways: always 2 vs. 2 only when necessary.
Always display 2 | 2 only when needed | |
|---|---|---|
Normal server | 2 | 1 |
Server at deployment | 2 | 2 |
Rollback speed | Very fast | Environmental regeneration may be necessary |
expense | height | Relatively low |
Availability | height | Relatively low |
So, to figure out which strategy would suit me, I checked the memory usage of my 2GB memory server.
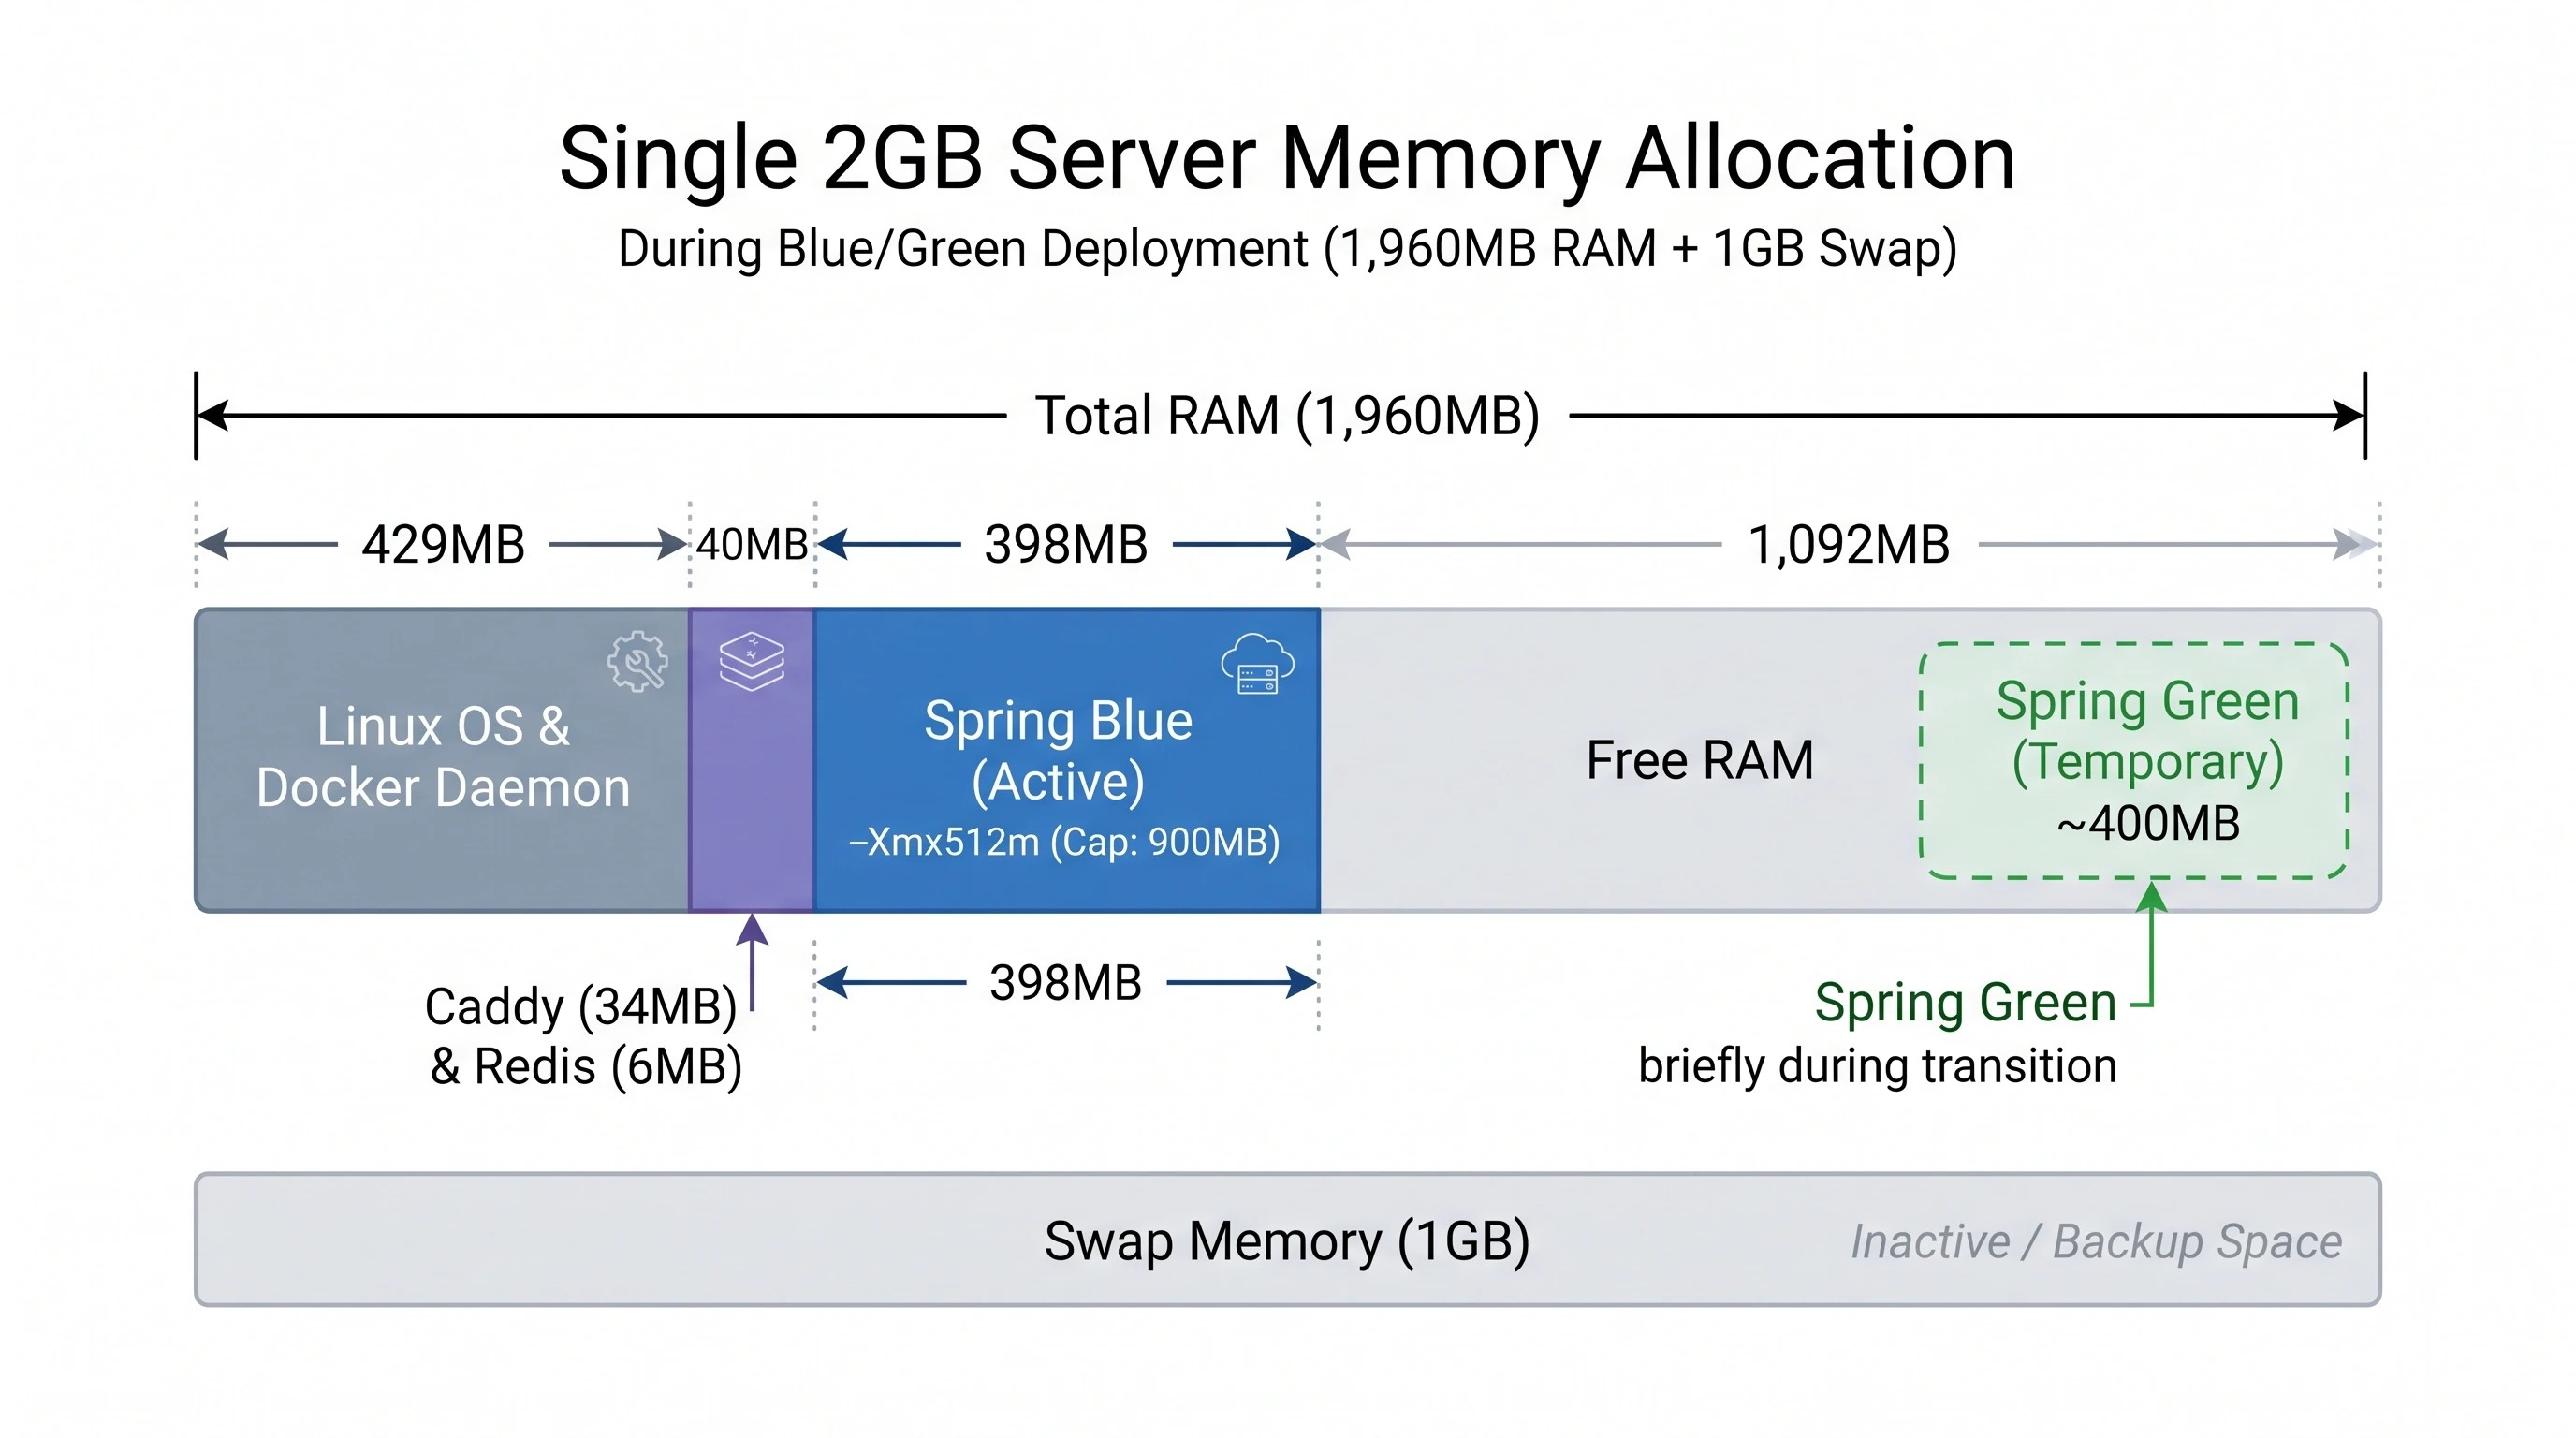
division | Actual memory usage |
|---|---|
Spring Boot (`carrot_back`) | Approx. 398MB |
Caddy (`carrot_caddy`) | Approximately 34MB |
Redis (`carrot_redis`) | About 6MB |
Linux OS, Docker daemons, etc. take up the default system resources | Approx. 429MB |
Current total usage | Approx. 867MB / 1,960MB (Remaining available memory approx. 1,092MB) |
The three containers themselves use only about 438MB , and even when combining the memory used by the Linux OS and Docker by default (about 429MB) , about 1.1GB (1,092MB) of the total 2GB is free. With 1GB of swap space on top of that, there was enough space to launch one more Spring container (about 400MB) for the short duration of deployment.
However, just in case the server crashes, and since the specifications are too low to run one more unnecessarily, I took two measures.
Setting a memory cap per container: Previously, the JVM setting was open with MaxRAMPercentage=60.0 (60% of 2GB of server memory = allowing up to 1.2GB ). Even if only 400MB is used normally, the 2GB server might not be able to handle it during a transition. Therefore, I set the heap memory per container to a maximum of 512MB (-Xmx512m, container limit 900MB).
Take down the previous container when the transition is complete: I set it up so that two containers are launched only during deployment, and only one is launched once the process is complete.
The changed deployment flow is as follows.
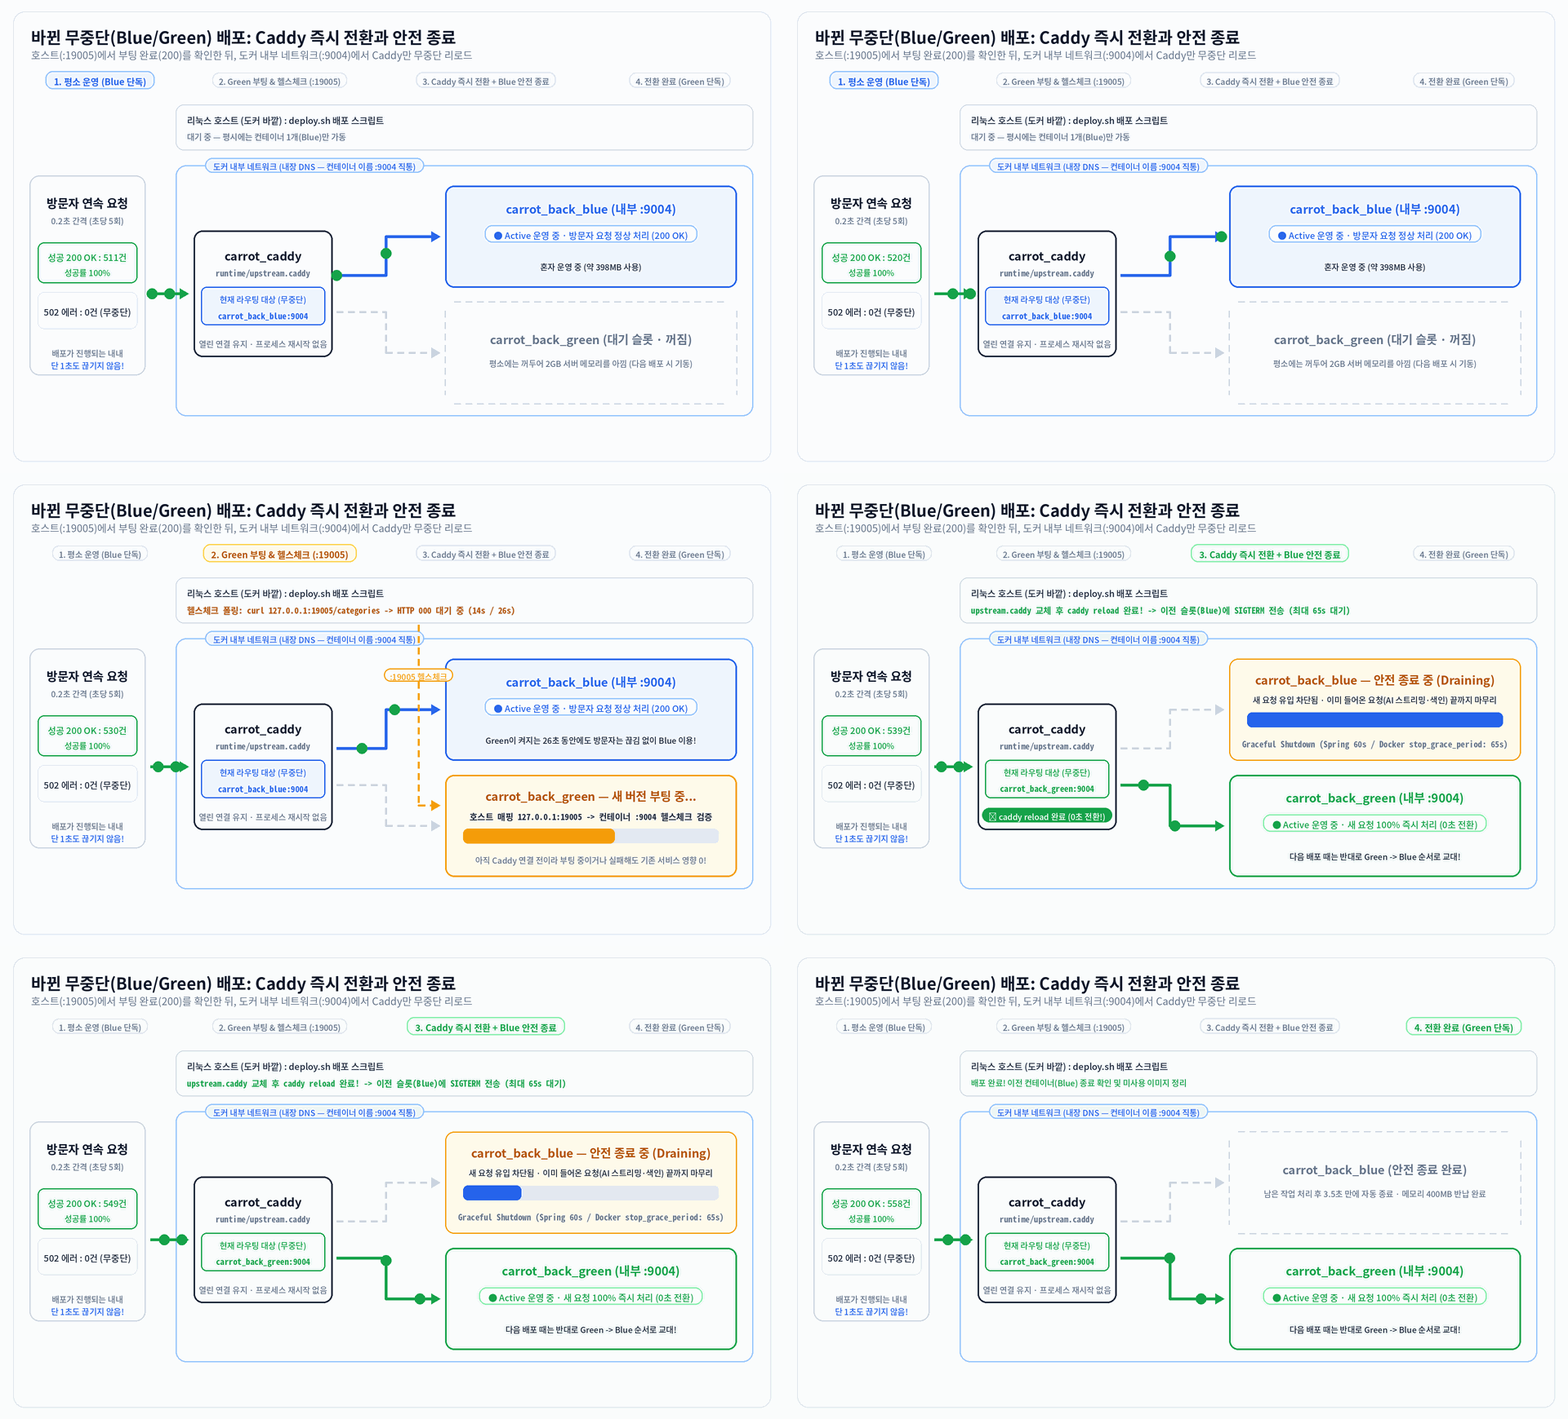
For the next deployment, we will switch them in the opposite order, alternating from Green to Blue.
Caddy configuration for zero-downtime deployment
Caddy is responsible for redirecting traffic. In this case, Caddy switches between Green and Blue using a reload method via a deployment script.
# caddy/Caddyfile (고정)handle { request_body { max_size 10MB } reverse_proxy { import /etc/caddy-runtime/upstream.caddy # 이 파일의 텍스트가 여기에 그대로 들어감 (ex. "to back_green:9000") header_up X-Real-IP {remote_host} }}The deployment script correctly converts the /etc/caddy-runtime/upstream.caddy file above from green to blue.
How the deployment script changes
Check current container color
Floating a new container in a different color
Run a health check on the new container until it reaches 200.
Replace the address of the upstream.caddy file with that of the new container.
Reload caddy to reflect settings
Remove previous container
Continue writing the existing container in case of an error during container replacement.
Finishing existing requests (Graceful Shutdown)
You should not remove the existing container immediately just because a new container has been launched. Requests that arrived 0.1 seconds before the transition, or the AI draft streaming (/ai/*) that was actively writing text, could be interrupted midway.
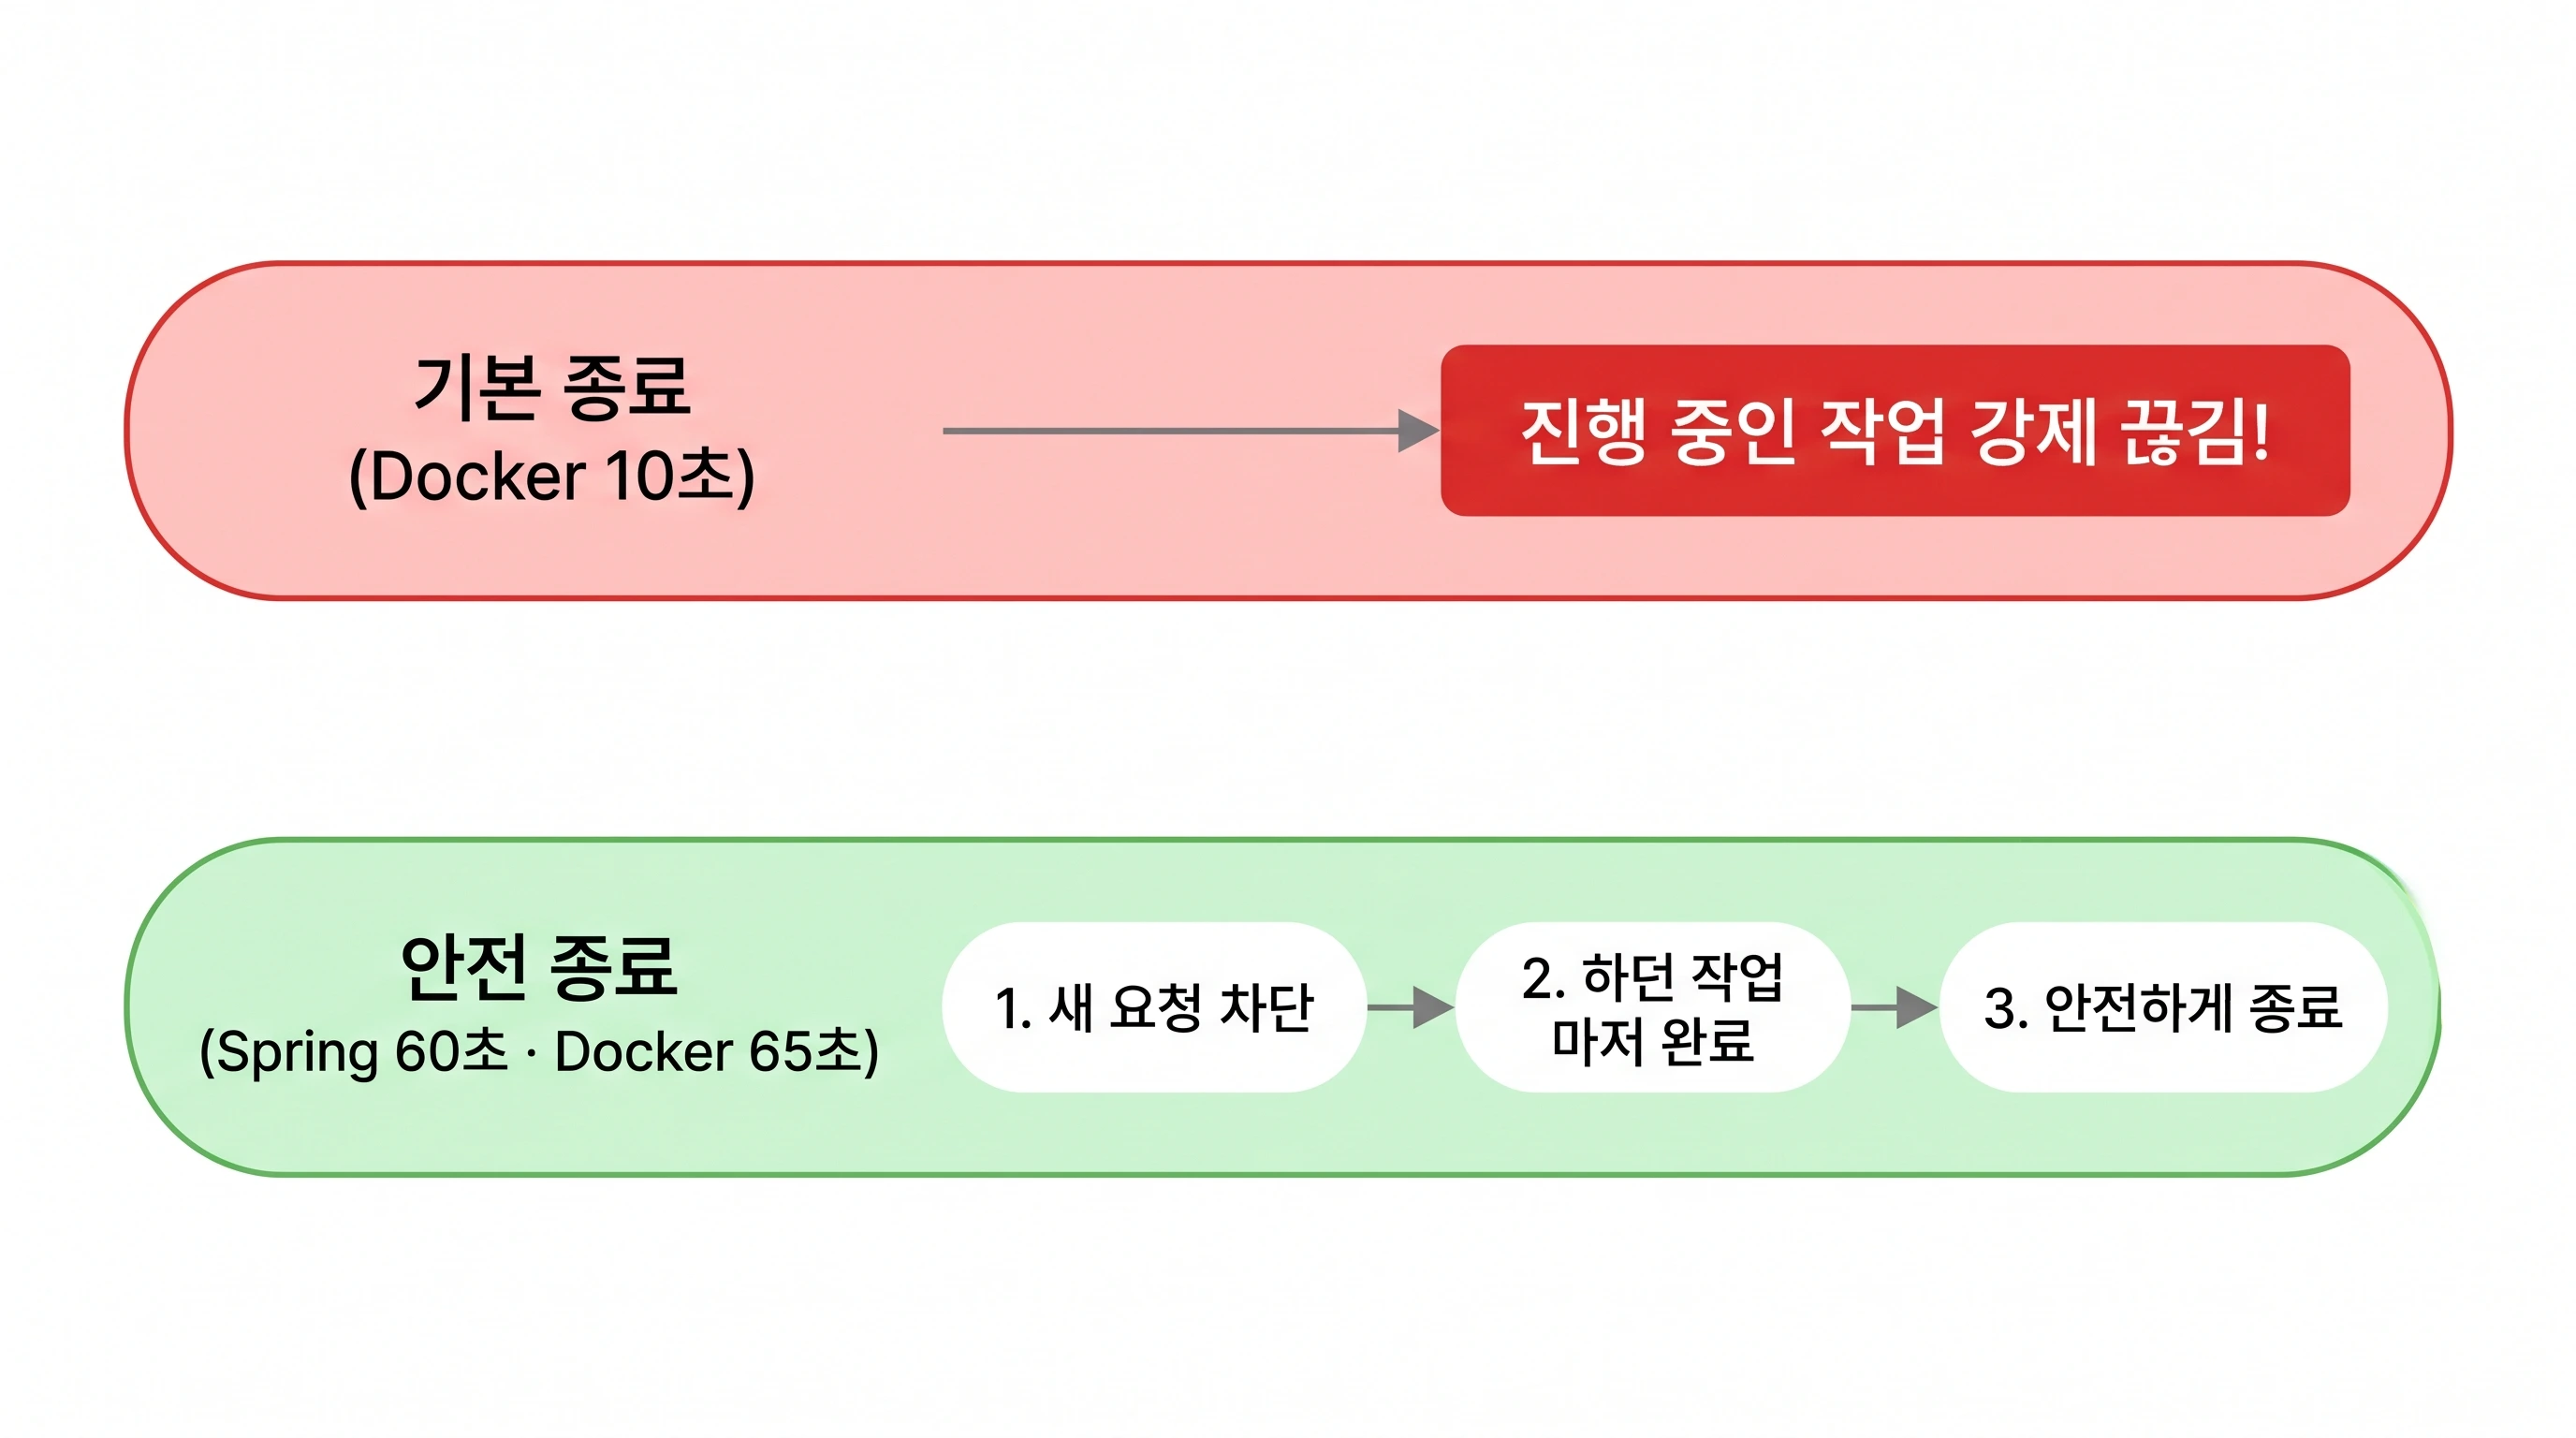
So, you need to configure it so that the server terminates existing requests and shuts down.
The deployment script sends a termination signal (SIGTERM) to the existing container after the caddy reload is finished.
I added `server.shutdown: graceful` and a maximum wait time of 60 seconds to the Spring Boot configuration. I also changed the wait time for Docker (`stop_grace_period: 65s`). This allows it to process incoming requests for 60 seconds.
Even if the web request is finished, the Weaviate vector index might still be running in the background thread (articleIndexExecutor), so I set it to wait for up to 30 seconds to finish this task as well before shutting down (waitForTasksToCompleteOnShutdown).
Check if there are any issues with the local cache (Caffeine).
This is something I hadn't considered while working with AI. If you use Redis, there is a high probability that you won't need to worry about it because it is a local cache isolated from the JVM. However, if you use Caffeine, Green and Blue do not share memory, so they get initialized.
So, I checked what impact the flows using Caffeine would have when the server started up after being newly initialized. I was prepared to move them to Redis if there was any impact.
Save location | data contained | When switching between Blue and Green |
|---|---|---|
Shared Redis container | Login Refresh token, views not yet merged into DB, AI/Search daily limits | Shared and maintained as is (login not logged out, views not lost) |
Caffeine inside each JVM | Post details, category list, sitemap, natural language search ranking (all expire in 10 minutes) | Not shared (new container starts empty) |
Upon checking the data managed as described above, I realized that if the data was missing from Caffeine, I could simply retrieve it from the DB and populate it. Of course, the response would be slowed down by the time it takes to communicate with the DB, but I determined that it would not have a significant impact.
Did it really not cut off for even a second after the Green/Blue switch?
Once the setup is complete, how do we usually verify whether the "zero-downtime deployment was successful"? Since simply accessing the site via a browser after the deployment is finished does not reveal if a 502 error briefly occurred during the transition, we verify this by continuously sending external requests throughout the deployment process and measuring the success rate and response time .
This time, while running the actual blue → green production deployment one more time, I tried calling it continuously from my PC at 0.2-second intervals (5 times per second) for about 2 minutes.
12:53:55 [deploy] Active slot: blue -> Target slot: green (127.0.0.1:19005)12:54:10 [deploy] Starting candidate container carrot_back_green...12:54:12 [deploy] Polling healthcheck on http://127.0.0.1:19005/categories (max 90s)...12:54:12 [deploy] Attempt 1/45: HTTP status 000, retrying in 2s...... (새 Spring Boot가 켜지는 약 26초 동안, 방문자는 계속 carrot_back_blue 이용)12:54:38 [deploy] Healthcheck passed on attempt 13 (HTTP 200).12:54:38 [deploy] Validating and hot-reloading Caddy -> carrot_back_green:9004...12:54:39 [deploy] Traffic switched to carrot_back_green.12:54:39 [deploy] Gracefully draining and stopping previous slot: app-blue (up to 65s)...12:54:42 [deploy] Blue/Green deployment complete (active: green). Pruning unused images...You can see the results in the table below.
division | Existing deployment (single container) | Blue/Green Distribution (Actual Measurement) |
|---|---|---|
Pause time during deployment | Approx. 32 seconds (11:05:33 → 11:06:05) | 0 seconds |
Consecutive request success rate | 32-second section, all failed (502) | 558 / 558 Success (100%, 0 failures) |
Response time (min / p50 / p95 / p99 / max) | - | 14.1 / 19.5 / 30.2 / 52.1 / 993.7 ms |
There were zero 502s until the moment of transition. Not a single one of the 558 requests was interrupted, not only during the 26 seconds when the green light turned on, but also between 12:54:38 and 12:54:39 seconds when the caddy reload occurred.
The identity of the maximum value of 993.7ms: Out of 558 requests, only 2 exceeded 100ms. Notably, the longest time of 993.7ms was recorded precisely at the transition moment immediately after a caddy reload, when green was reading the first list of posts from Cloud SQL from an empty cache . Immediately following that, the request 0.2 seconds later was 61.1ms, and the next request was 23.7ms, returning to normal speeds right away.
The previous container cleanup also finished in 3.5 seconds. app-blue, which received the shutdown signal at 12:54:39, finished the remaining processing and went completely down at 12:54:42.
Now, with every deployment, we can alternate between blue → green → blue, ensuring uninterrupted visitor distribution.
Things I gained and things I want to try in the future
What I gained this time
The pause time during deployment has become 0 seconds. I feel really proud!! It doesn't matter since there are no users, but I'm still proud.
It does not interrupt ongoing requests. At the moment of transition, it completes any requests or indexing tasks that were in progress before proceeding.
Deployment failures do not lead to outages. If the new version is not turned on, the old version continues to maintain the service.
The additional cost is 0 won.
Things I want to try in the future: Canary distribution
Since the visitor volume is small and I currently have only one server, I think Blue/Green is the best fit because it allows for a clean transition in one go. In fact, using Caddy's weighted routing or cookie sticking features would allow me to mimic a canary deployment where only a portion of the traffic is sent to the new version even on a single server; however, considering the current scale of my service and the number of users, these features are practically useless. As a developer, I could not accept the decision to even attempt a canary deployment...
Later, when I grow my blog or a new service and the number of users increases and the number of servers expands, I definitely want to try Canary deployment in practice.